Tide Gate Survey
Velocity and depth data collected across two tide gates to support a wetland restoration project.
Velocity
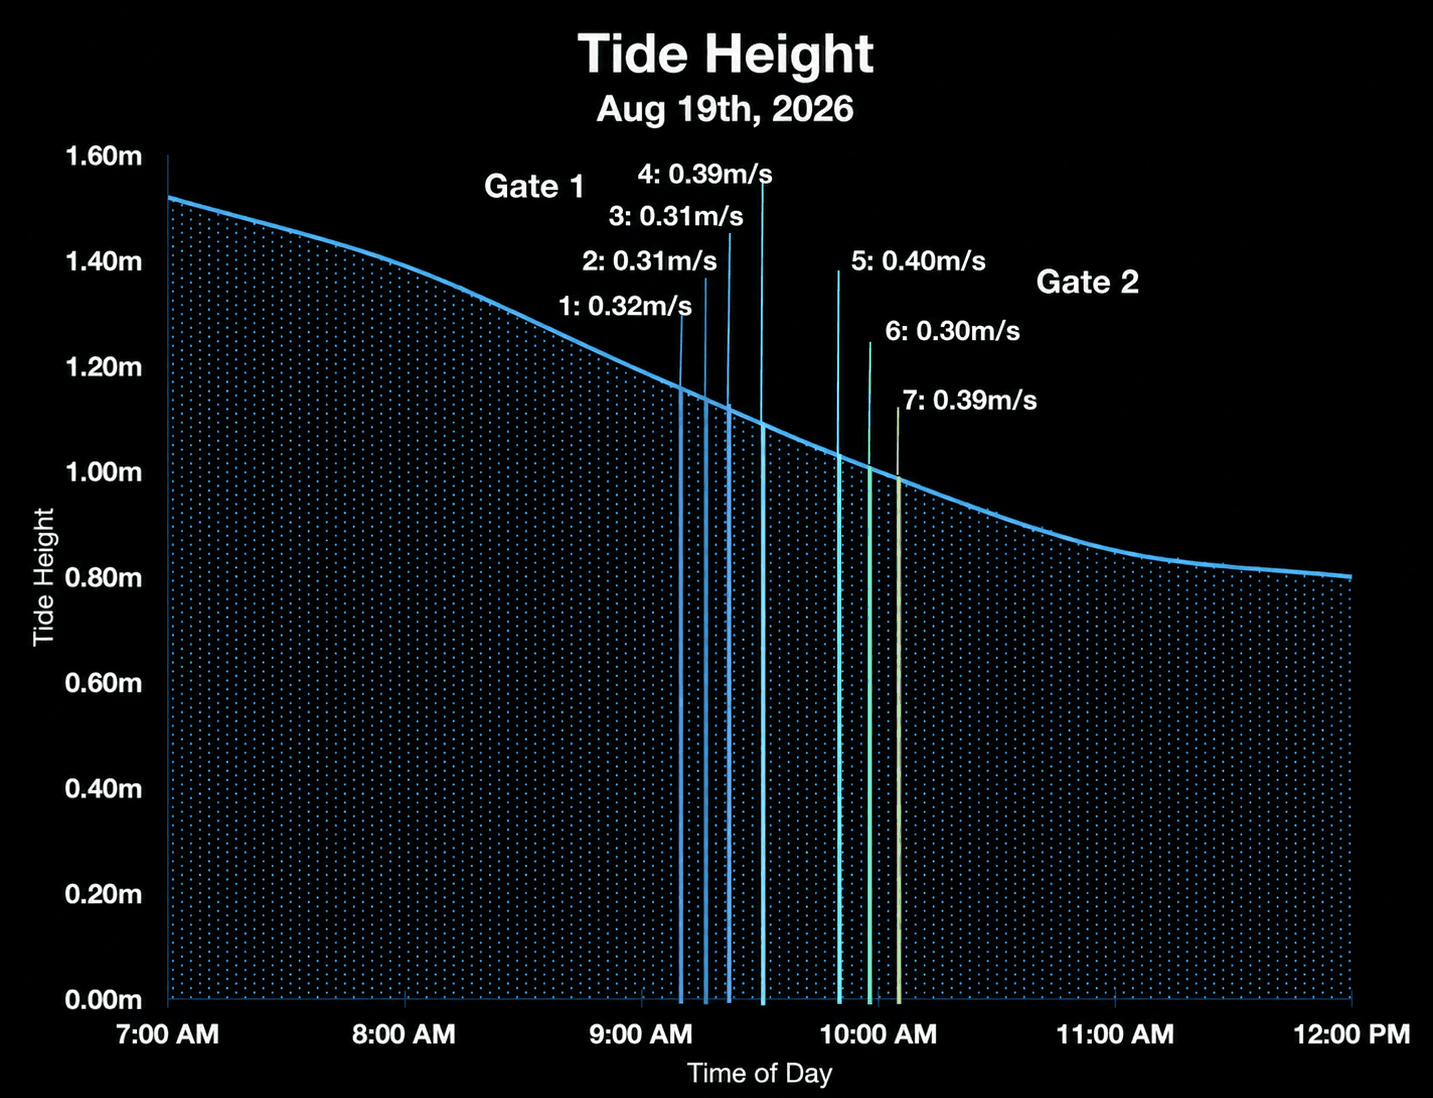
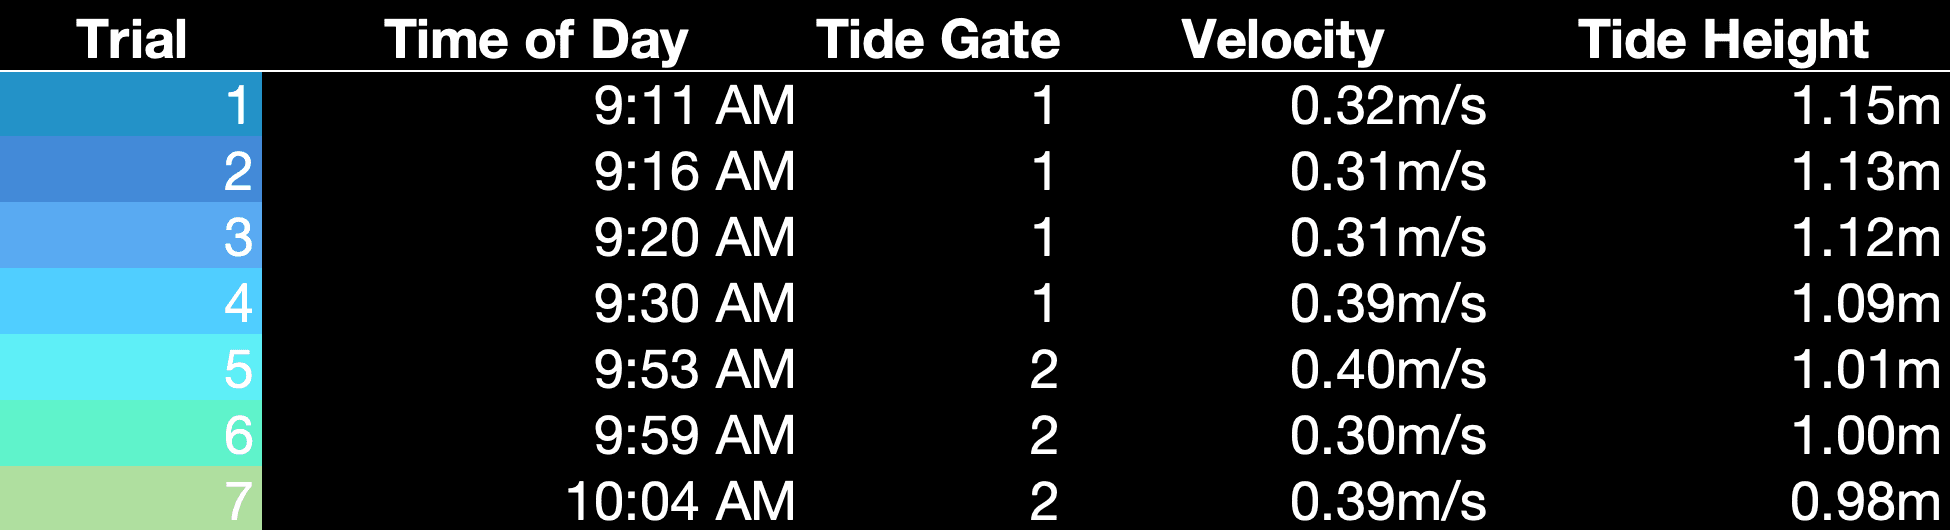
- The drone drifts naturally with the current through each tide gate, allowing a continuous sampling of data.
- Velocity calculations are derived from continuous RTK GPS recordings.
Bathymetry
Live survey data: drag to pan, scroll to zoom, hover for depth.
- A single-beam sonar on the drone measures water depth as it moves across the channel.
- RTK-corrected GPS records the location of each depth reading with high precision.
- Our software post-processes GPS and sonar data to remove outliers and generate bathymetric maps.